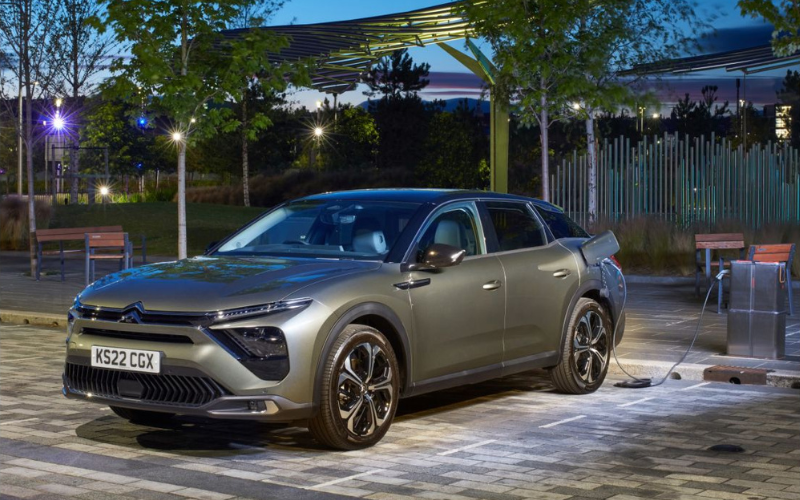
Citroen Name Top Local Authorities Helping to Develop Public Charging Network
Using Government data, the French car manufacturer shared the top local authorities who have seen the biggest increase in public charging since October 2019.
Citroen has named the top local authorities who have seen the biggest increase in public charging over the last three years.
The research comes after it was discovered that plug-in electric vehicles account for 21% of cars on the new car market in the UK, according to the Society of Motor Manufacturers and Traders (SMMT).
It was based on the number of charging devices available per 100,000 people, and Welwyn Hatfield in Hertfordshire was highlighted as the highest performer with the biggest growth in public charging devices, with an impressive 754% rise.
This means there are currently 90.4 charging devices per 100,000 people, compared to just 10.6 in 2019.
Brighton and Hove, East Sussex, came in second with a 496% increase in public charging points per 100,000 people, with 121 charging points accessible to residents as of October 2022.
When conducting the research, Citroen compared public charging data from October 2019 to October 2022, with local authorities being required to have at least 10 charging devices for every 100,000 people in order to participate.
When looking at public charging devices per local authority, Westminster came out on top with 1,494 devices accessible, followed by Wandsworth and Coventry with 873 and 695 respectively.
In total, the UK has seen a fantastic 129% rise in public charging facilities over the last three years – a positive and promising sign that it can only expand further as the future of electric motoring becomes a reality for more and more motorists.
In October 2022 alone, there were 34,637 charging points accessible across the nation, with 6,395 of these rapid public chargers (over 25kW).
Citroen’s research also looked into the increases in the number of rapid public charging facilities per 100,000 over this same period and Stafford, Staffordshire recorded the highest here, with a rise of 435% since October 2019. This means the area now has 27.6 rapid chargers available per 100,000 people, compared to just 5.2 in 2019.
The second and third highest increases per 100,000 people came from South Gloucestershire and North Warwickshire.
Eurig Druce, Citroen UK’s Managing Director, said:
“Widespread access to public charging points is one of the cornerstones that must be in place as we push towards making the UK a true electric vehicle nation.
As Citroen moves towards offering electrified variants across its entire model range by 2025, our research highlights which local authorities are recording the biggest percentage increases in public chargers for their residents.”
Top 10 local authorities recording the highest increase in public charging devices per 100,000 people since October 2019:
| Local Authority/Region Name | No. of public charging devices per 100,000 - Oct 2022 | No. of public charging devices per 100,000 - Oct 2019 | Percentage change Oct 2022 compared to Oct 2019 |
|---|---|---|---|
| Welwyn Hatfield | 90.4 | 10.6 | 753.6% |
| Brighton and Hove | 121.0 | 20.3 | 495.6% |
| Kingston upon Thames | 89.3 | 15.4 | 480.5% |
| North Warwickshire | 61.1 | 12.3 | 395.40% |
| Barnet | 82.7 | 17.3 | 376.9% |
| Dartford | 73.7 | 15.5 | 375.3% |
| Cherwell | 90.9 | 20.1 | 351.9% |
| Bolsover | 55.3 | 12.6 | 340.2% |
| Southwark | 213.4 | 48.5 | 339.7% |
| Coventry | 183.2 | 42.5 | 330.7% |
Source: Citroen
Top 10 local authorities recording the highest increase in rapid public charging devices per 100,000 people since October 2019:
| Local Authority/Region Name | No. of rapid public charging devices per 100,000 - Oct 2022 | No. of rapid public charging devices per 100,000 - Oct 2019 | Percentage change Oct 2022 compared to Oct 2019 |
|---|---|---|---|
| Stafford | 27.6 | 5.2 | 435.1% |
| South Gloucestershire | 25.4 | 5.0 | 412.1% |
| North Warwickshire | 30.6 | 6.2 | 395.4% |
| Thurrock | 25.1 | 5.2 | 380.5% |
| Bolsover | 22.1 | 5.0 | 340.2% |
| Dartford | 35.1 | 8.2 | 327.5% |
| Hammersmith and Fulham | 26.7 | 6.5 | 312.5% |
| Exeter | 21.0 | 5.4 | 291.3% |
| Greenwich | 19.7 | 5.2 | 276.3% |
| Harrogate | 21.0 | 5.6 | 275.4% |
| South Lanarkshire | 19.3 | 5.6 | 242.5% |
Keep up to date with more useful information and advice via our newsroom.